Problem
CANY has a database with quantitative and qualitative information about conditions in prisons, which includes 73 separate issues under 5 categories. They want to use the above data to understand trends in harmful prison practices and conditions.
Solution
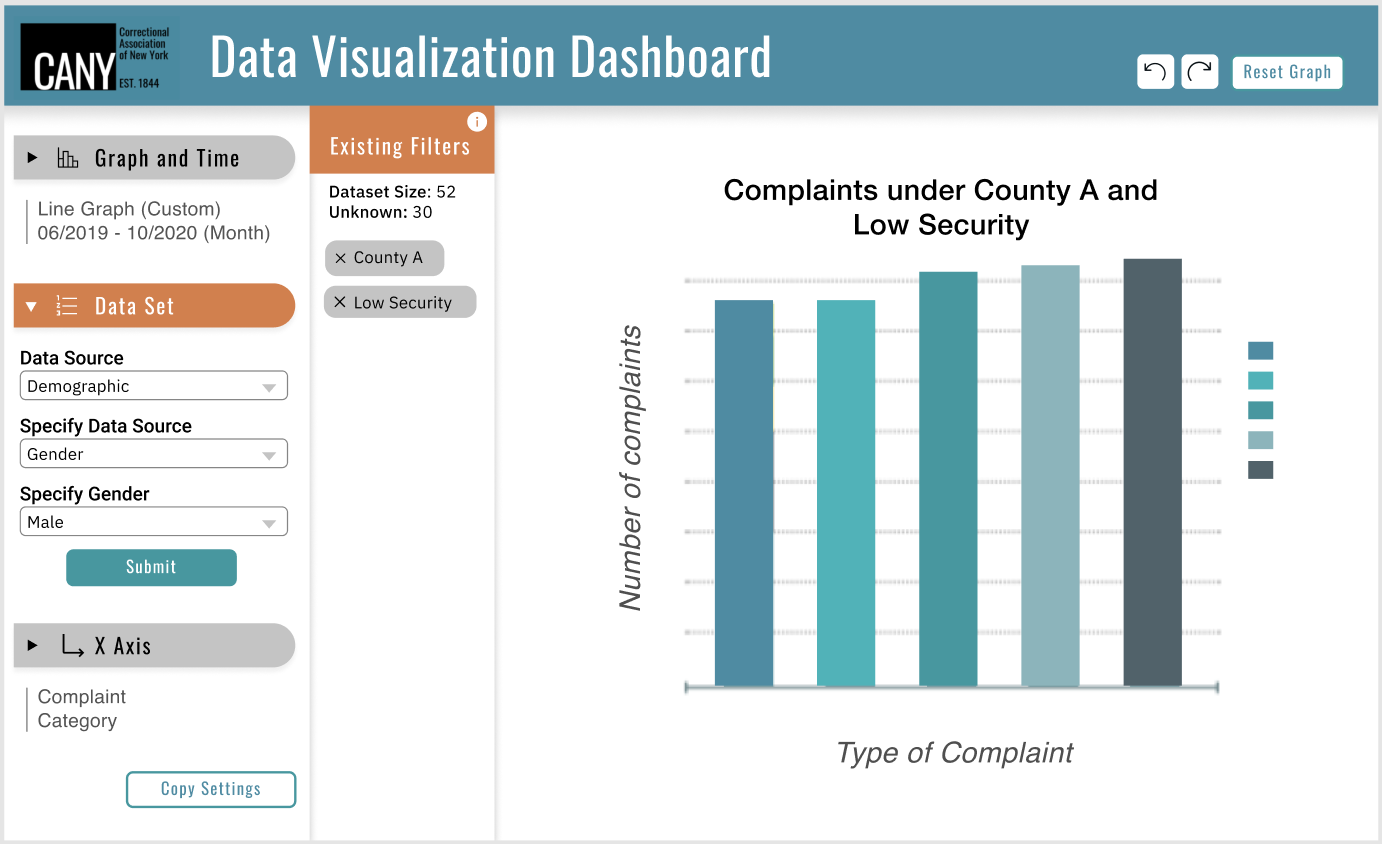
We helped CANY by creating a tool that provides data visualization for prison complaints in a quick and intuitive way.
This data visualization dashboard will help CANY determine which prisons need monitoring, what conditions are escalating, trends over time, etc. This will be accomplished through a series of steps:
Scrape the web for information from DOCCS with inmate lookup to get demographics
Integrate with existing Postgres database
Have existing React front-end for workers to input letters with categories into database
Incorporate a range of features from time, specific conditions, demographics, etc.
For all inquiries of partnership or sponsorship, please contact us at cornell@hack4impact.org.